Monitoring TeamCity using JMX
17 January 2017
Most of this post was written a few years ago but I never got around to finishing it. So after adding some images showing the MBean attributes as viewed using Java VisualVM and updating the summary, here it is.
Where I used to work we had been using TeamCity for a number of years, and I developed a plugin to expose a number of the server’s metrics via JMX so that we could track what it was doing over time.
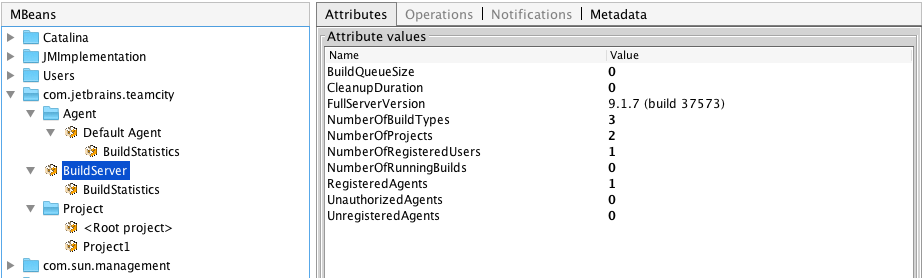
To give an idea of the attributes that can be monitored by the plugin the following images show the MBean attributes for a couple of the objects. The first image shows the Build Server’s MBean attributes. Some of the attributes that will be discussed later in this post are BuildQueueSize, RegisteredAgents, NumberOfRunningBuilds and CleanupDuration
The next image shows the MBean attributes for a Build Agent, specifically the Default Agent. If there were more build agents, each would appear as a separate node under the Agent node.
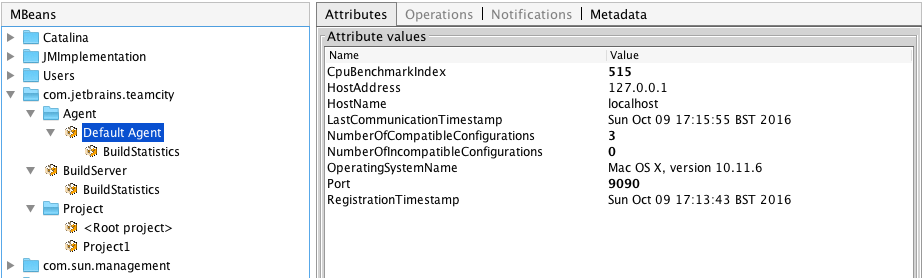
Additionally both have a BuildStatistics node with the following attributes, BuildsStarted, BuildsFinished, BuildsInterrupted, SuccessfulBuilds, FailedBuilds and IgnoredBuilds.
What we started to track was, build agents connected and available to run builds, the number of builds running and the number of builds in the build queue. Another important metric was server availability, TeamCity has a cleanup process that runs each night and during the cleanup it’s unavailable. Having teams around the world means there is only a small window for the clean up to happen, but we didn’t know how long it typically took.
The graph below is from the Munin monitoring tool which was configured to collect build agents available, running builds and build queue size. These are the BuildServer MBean attributes RegisteredAgents, NumberOfRunningBuilds and BuildQueueSize.
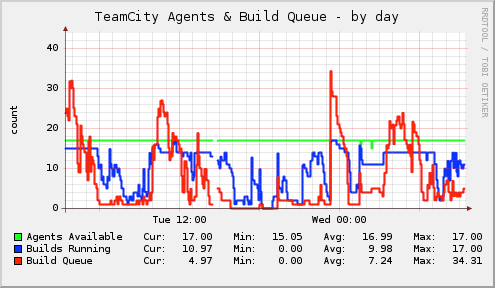
The blue line shows build agents running builds, and it shows that they a kept busy most of the time. The spike in the build queue, the red line, above the 'Wed 00:00' label is when a number of maintenance builds that run on all the agents are scheduled.
Another example shows the build activity for a week, most days are the same, the days labeled '01' and '02' are the weekend.
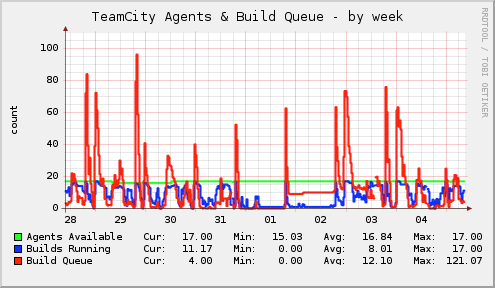
Again the nightly maintenance tasks show up as spikes each day. One interesting problem is for day '02', the build queue has a number of builds, agents are availble but the queue doesn’t decrease. One possible cause of this is a build stuck on an agent and the queued builds are maintenance tasks for that agent. Another is a resource monitor plugin that we use that can prevent builds from running if the resource isn’t available, i.e. a database server.
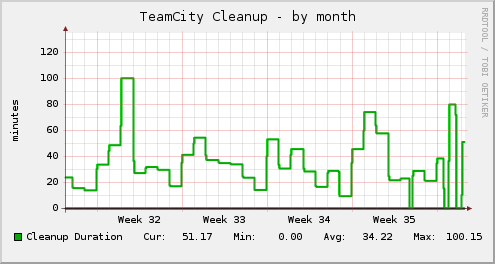
The next graph shows the cleanup time for a month. It shows a variation in the amount of time that TeamCity is unavailable, some days its only 15-20 minutes others its 90 minutes or more. There a few points on the graph where 0 is recorded, this is due to the server being restarted, the JMX plugin only makes the cleanup time available after a cleanup has occurred.
The time taken is becoming a problem with us having teams around the world using the server, the following issue is to address this and should hopefully make it into version 9, TW-2527: Ability to have TeamCity server online 24/7
Integration to Munin
The JMX plugin only provides the current values when queried, to record the values over time and highlight trends the Munin monitoring tool was configured to collect various values. Munin makes this data available in graphs for the current day, week, month and year.
To integrate with Munin requires a plugin, the jmxquery plugin is available in the Munin plugin GitHub repository under the contrib directory. There are instructions on where to download the plugin and configure Munin in this README file.
Summary
That was just a few examples of how JMX and Munin can be used to monitor a continuous integration server. The graphs produced by Munin allowed normal daily behaviour to be observed and allowed problems to be identified. Using JMX and Munin was useful at the time but there maybe better options now for tracking what your continuous integration server is doing. Newer versions of TeamCity have the 'Usage Statistics' page but it may still be useful to collect values using JMX.
I had the intention of extending the plugin to expose more attributes using JMX but never got around to it. The code for plugin is available on GitHub and the project page has instructions on how to build it or alternatively it can be downloaded from the TeamCity Plugins repository or Bintray